Every signalized intersection has a red-light running rate. Few agencies know theirs. Crash reports capture the outcomes, but they say little about the hundreds of late entries that happen each week before one of them ends in a collision.
Why Red-Light Running Stays Hidden
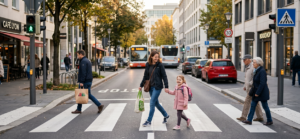
In 2024, red-light running crashes killed 1,119 people and injured more than 141,000 (per IIHS). About half of those killed were pedestrians, bicyclists, or people in other vehicles hit by the red-light runner. These are right-angle and turning crashes, among the most severe outcomes at any signalized intersection.
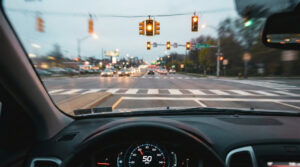
Some red-light running is a choice. Some of it is built into the intersection. FHWA warns that a yellow change interval that’s too short can leave drivers unable to stop safely, causing unintentional red-light running. A yellow that’s too long teaches drivers to treat it as an extension of green (FHWA Proven Safety Countermeasures).
The hard part is knowing which intersections have the problem. Crash reports show where something already went wrong. Enforcement cameras cover only a few approaches. Most agencies have no corridor-wide record of how often, when, or how late vehicles enter on red, so countermeasures are chosen from complaints and crash history instead of measured behavior.
How Red-Light Running Detection Works
Measuring red-light running comes down to one question: what was the signal showing at the exact moment each vehicle crossed the stop bar? Answering it takes two data streams joined on the same clock. The first is the controller’s phase state: green, yellow change, or all-red clearance. The second is the vehicle trajectory: where each road user is, how fast it’s moving, and when it crosses the stop line.
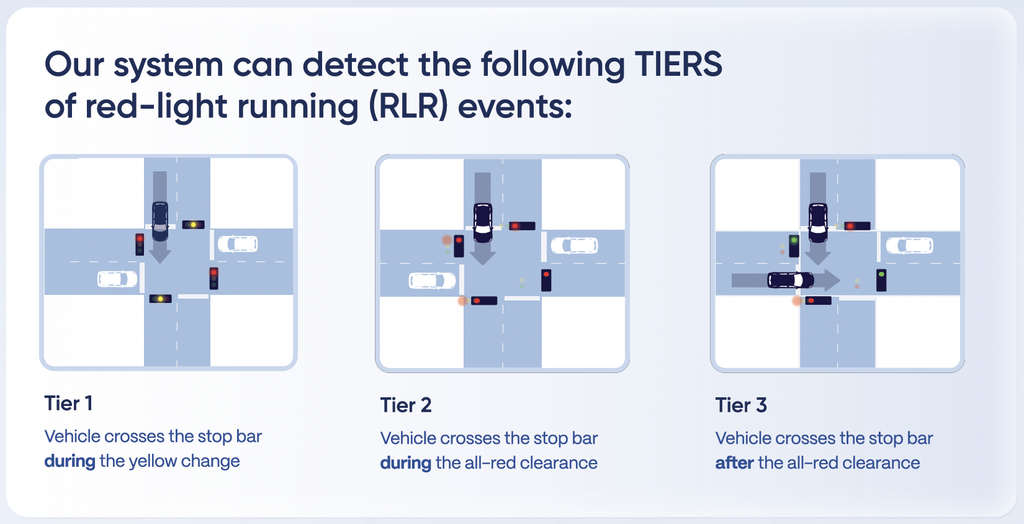
When both streams are timestamped together, every crossing can be classified by how late it happened in the cycle. Severity grows with each tier:
| Tier | Vehicle crosses the stop bar | What it suggests |
|---|---|---|
| Tier 1 | During the yellow change | Late entries; a leading indicator of yellow timing or approach-speed issues |
| Tier 2 | During the all-red clearance | Clearance interval is absorbing the violation, with little margin left |
| Tier 3 | After the all-red clearance | Conflicting movements may already have green; highest crash risk |
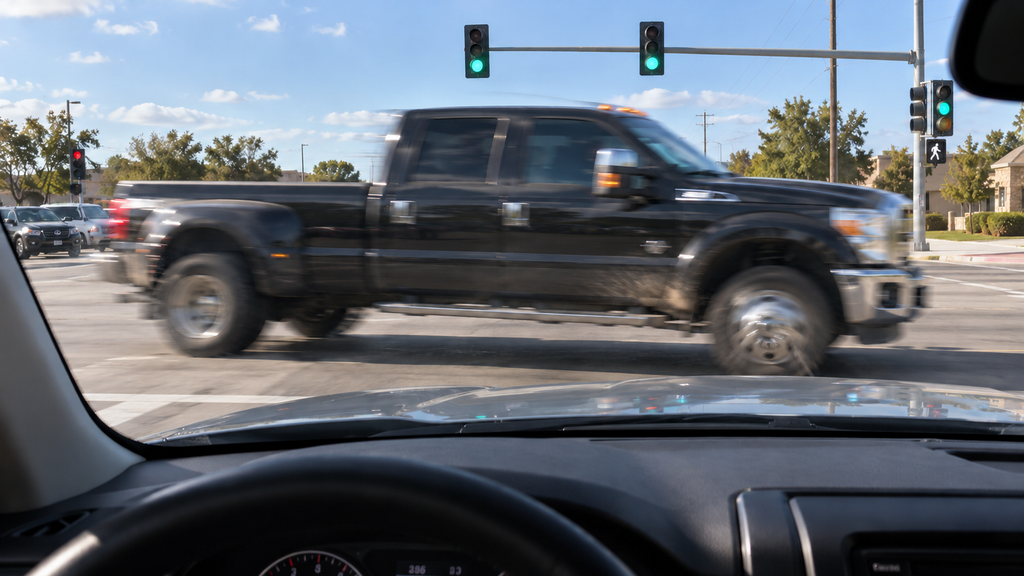
The pattern across tiers is as useful as the count. A high Tier 1 share on one approach points toward a yellow timing review under the MUTCD and NCHRP Report 731 guidance. Tier 3 events clustered at night may call for enforcement or visibility treatments. Repeating the count after a change shows whether it worked.
From Detection to Countermeasure
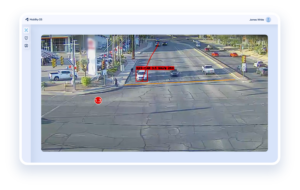
The NoTraffic Red-Light Running application runs on the NoTraffic fusion sensor that also handles intersection detection, and is activated from the Mobility Store. It correlates signal phases with every stop-bar crossing and classifies each event as Tier 1, 2, or 3.
Engineers can filter events by time of day, frequency (hour, day, week, or month), and road user type, then review video to understand the context of a specific event. Trends roll up from a single approach to a citywide view, so the intersections with the highest violation rates surface first. A before-and-after comparison shows whether a retimed yellow, an added all-red, or an enforcement push actually reduced violations.
See Your Own Intersections
To find out what red-light running looks like across your corridors, book a demo with the NoTraffic team to see how Red Light Running Insights can help your agency.