There’s an old bit of safety folklore that it takes three things going wrong to cause an accident. With one, you get lucky. With two, you barely escape. With three, you’re in trouble.
It isn’t a scientific law, but epidemiology has a formal version of the same idea. And it points to something traffic safety programs might overlook: for every crash where multiple events line up, there are many more close calls where only one or two did.
Why Crash-Based Evaluation Takes So Long
A before/after crash study is the standard way to judge whether a countermeasure worked. Crash-based safety analysis typically works from three to five years of crash data (per FHWA), and a before/after study needs that on each side of the change. For a project built this year, that puts a defensible answer near the end of the decade.
The delay is only part of the problem. A single intersection may record a handful of crashes a year, so small counts swing widely from one year to the next. Sites are also usually treated right after a bad stretch, which brings in regression to the mean: crashes would likely have dropped anyway, so a simple comparison overstates the benefit (the FHWA CMF Clearinghouse protocols point to the Empirical Bayes method to correct for this). Volumes, land use, and nearby projects change during the wait as well.
The result is that many countermeasures are never formally evaluated. Agencies make the next round of decisions without knowing what the last round did, and leading pedestrian intervals, protected lefts, and timing changes get repeated or dropped based on anecdote.
Crashes Rarely Have a Single Cause
In 1976, epidemiologist Kenneth Rothman introduced the sufficient-component cause model, now part of CDC’s epidemiology training (per CDC, Principles of Epidemiology). It shows how an outcome can result from several component causes acting together, even when none would be enough on its own.
Traffic research points the same way. NHTSA’s Tri-Level Study found human factors were a probable cause in 92.6% of the crashes investigated, environmental factors, including the roadway, in 33.8%, and vehicle factors in 12.6% (per Treat et al., 1979). Those shares add up to well over 100% because many crashes had more than one cause.
At an intersection, the components look familiar: a yellow that runs slightly short for the approach speed, a wide crossing that leaves pedestrians exposed, a turning truck that hides someone in the crosswalk, a driver who glances down at the wrong moment. Each is survivable alone. A crash happens when enough of them line up. FHWA’s Safe System Approach is built on the same idea, adding layers of protection “so that if one part fails, the other parts still protect people” (per FHWA).
Near misses are the moments when the causes almost lined up and one layer still held. That makes them useful for evaluation: a countermeasure works by removing a component, and conflict data shows whether it did.
Measuring Lower on the Safety Pyramid
Traffic safety researchers often describe road user interactions as a pyramid (per Hydén’s safety pyramid, Lund University). Crashes sit at the narrow top. Below them are serious conflicts, then minor conflicts, then the wide base of ordinary, uneventful movements. The layers share the same causes; they differ in how often they happen.
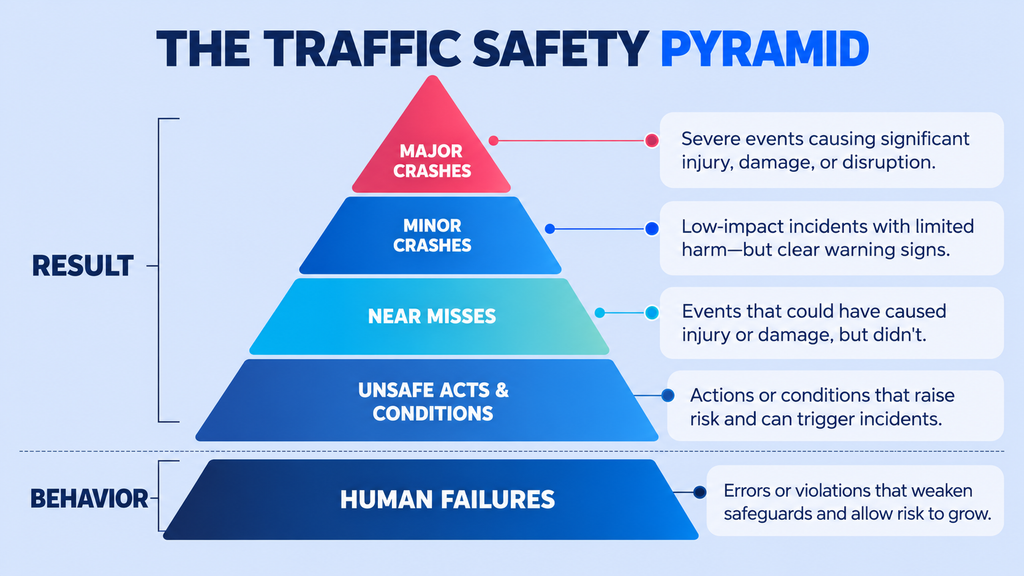
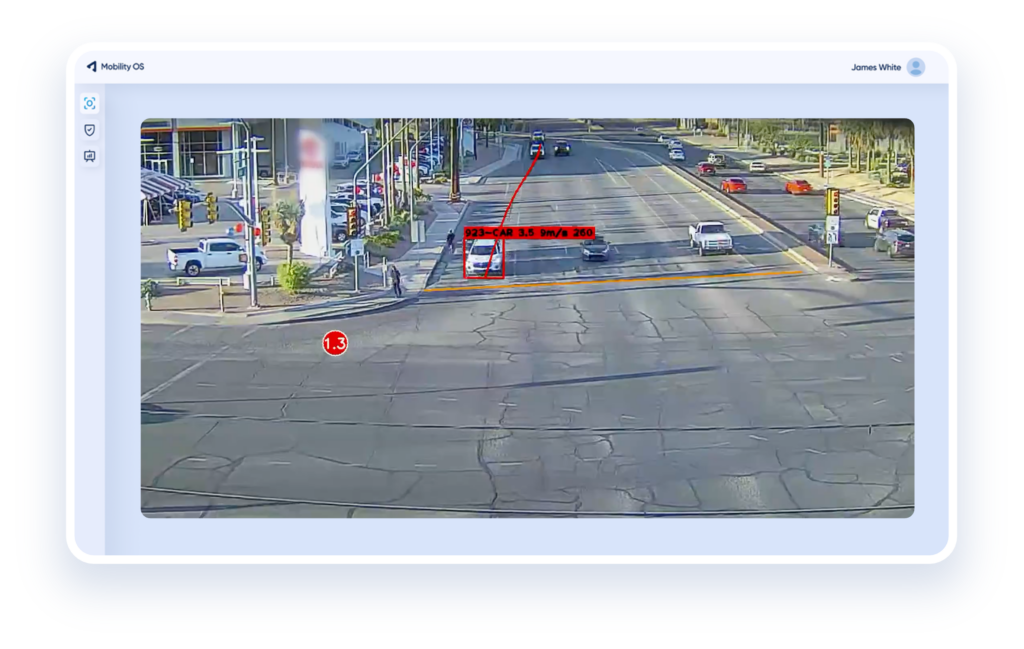
Evaluation speeds up by measuring the layer just below crashes. Two surrogate safety measures define it. Time to Collision (TTC) is how many seconds remain before two road users would collide on their current paths. Post Encroachment Time (PET) is the gap between one road user leaving a conflict point and the next one arriving. The lower either value, the closer the call. FHWA has studied both as a way to assess safety without waiting for crashes (per FHWA’s Surrogate Safety Assessment Model research).
Because conflicts happen far more often than crashes, a few weeks of data can show a change that crash records would take years to show:
| Crash-based before/after | Conflict-based before/after | |
|---|---|---|
| Events per intersection | A few per year | Hundreds per month |
| Time to a usable result | 3–5 years per period | Weeks per period |
| Regression to the mean | Significant; needs statistical correction | Reduced by a continuous baseline |
| Detail | Crash type and severity | Movement, lane, road user type, time of day |
Conflict data does not replace crash history. It gives engineers an early, measurable signal while the crash record builds.
Building the Before/After Record
NoTraffic Near Miss calculates TTC and PET continuously for every vehicle, cyclist, and pedestrian interaction. It runs on the same NoTraffic fusion sensor agencies use for detection, so it can be activated without a separate study or new field hardware. Turn it on before a change goes in, and the baseline is already being recorded when construction or retiming begins. From there, engineers can:
- Compare conflict counts and severity before and after, filtered by movement, lane of origin, and road user type
- Use heatmaps to check whether conflicts went away or moved to another approach
- Review video of high-severity events to confirm the countermeasure is addressing the intended conflict
- Export PDF or CSV results for council updates, grant reporting, and the agency’s own countermeasure records
The result is an answer to “did it work?” while the project is still fresh, with enough detail to adjust if it didn’t.
Start With a Baseline
Book a meeting with one of our traffic experts to find out how you can use near-miss data to improve safety at your intersections.
Sources
- Step 2. Conduct Network Screening — FHWA (three-to-five-year crash data periods)
- Recommended Protocols for Developing Crash Modification Factors — NCHRP 20-7(314), FHWA CMF Clearinghouse, 2012 (regression to the mean, Empirical Bayes)
- The Swedish Traffic Conflict Technique: Observer’s Manual — Laureshyn & Várhelyi, Lund University, 2018 (Hydén’s safety pyramid)
- Surrogate Safety Assessment Model and Validation: Final Report — FHWA-HRT-08-051, 2008 (TTC and PET as surrogate measures)
- Principles of Epidemiology, Lesson 1, Section 8 — CDC (Rothman’s component cause model, 1976)
- Tri-Level Study of the Causes of Traffic Accidents: Executive Summary — Treat et al., NHTSA, DOT-HS-805-099, 1979 (human, environmental and vehicle factors)
- The Safe System Approach — FHWA-SA-20-015 (redundancy principle)