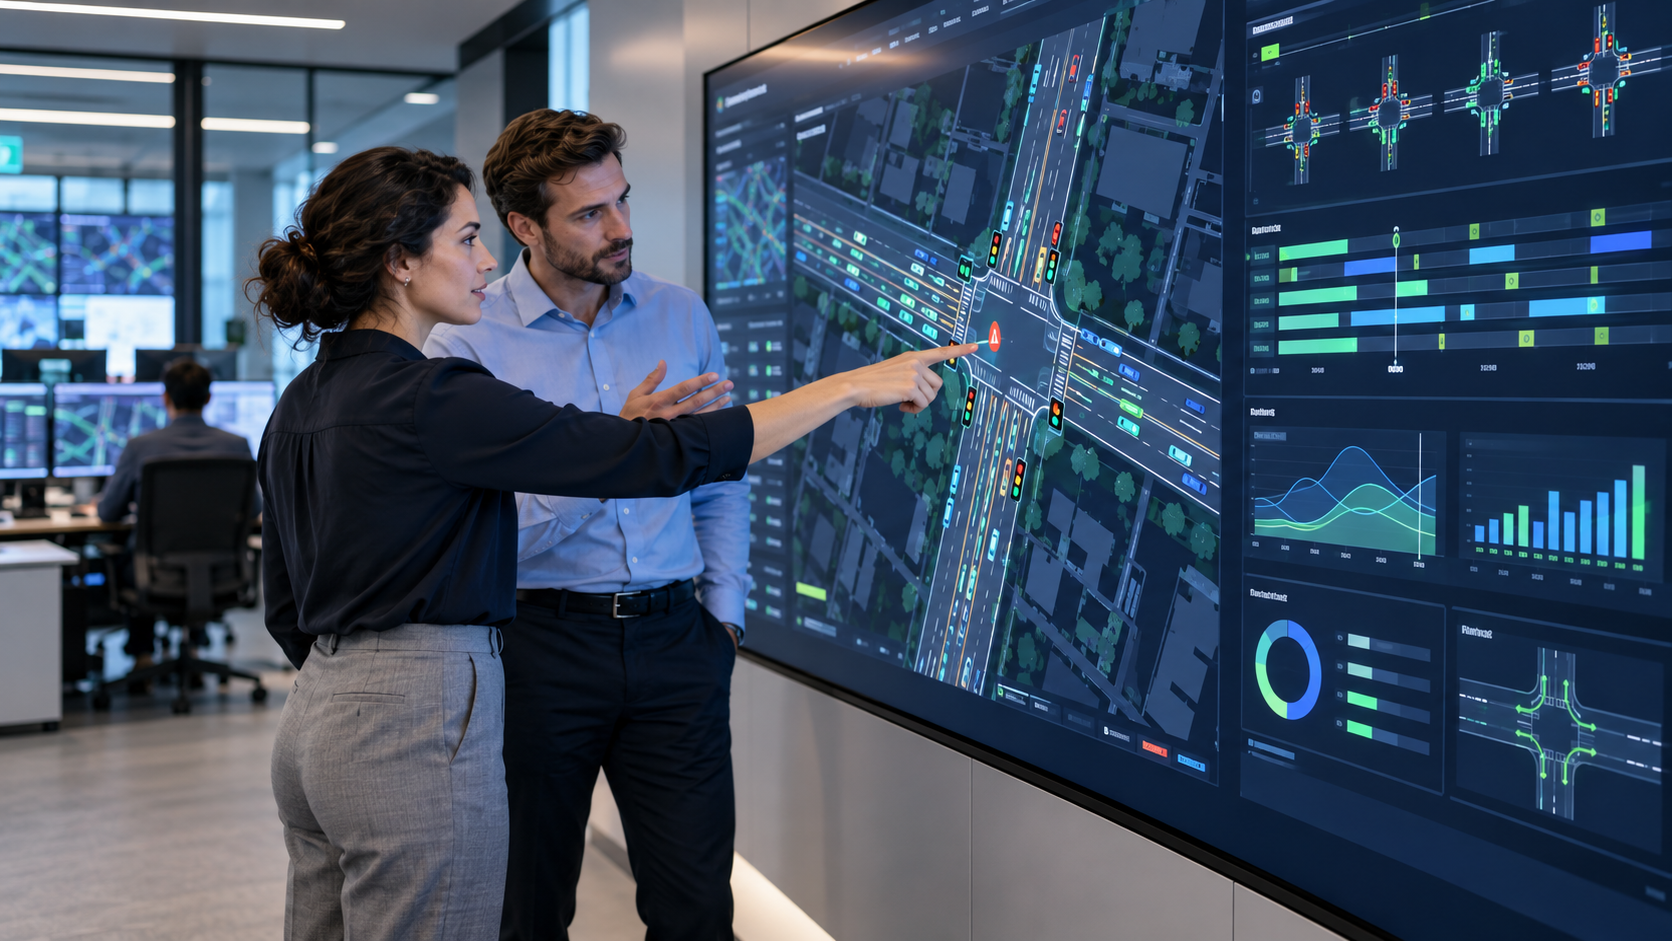
Monday morning: 180 signals, two technicians, and a stack of complaint tickets. Which intersection gets the first truck roll? At most agencies, the answer goes to whoever called loudest.
Signal timing goes stale between retiming cycles
There are more than 330,000 traffic signals in the United States, and most agencies retime them on a three- to five-year cycle at roughly $4,500 per intersection (per FHWA). Traffic doesn’t wait for the schedule. Land use shifts, a school opens, a detector fails, and a plan that worked at retiming can degrade within months.
The industry has graded itself on this for years. The 2012 National Traffic Signal Report Card gave U.S. signal operations an overall D+ (per NTOC/ITE).
The root issue is prioritization. Without continuous data, problems surface through complaint calls, often weeks after performance started to slip. Staff time goes to chasing tickets, and intersections that quietly underperform never make the list.
How ATSPMs work
Automated Traffic Signal Performance Measures (ATSPMs) turn the controller’s own event log into a continuous record of how each intersection performs. The concept grew out of research by Indiana DOT and Purdue University, was scaled by Utah DOT, and was promoted nationally through FHWA’s Every Day Counts program (per FHWA).
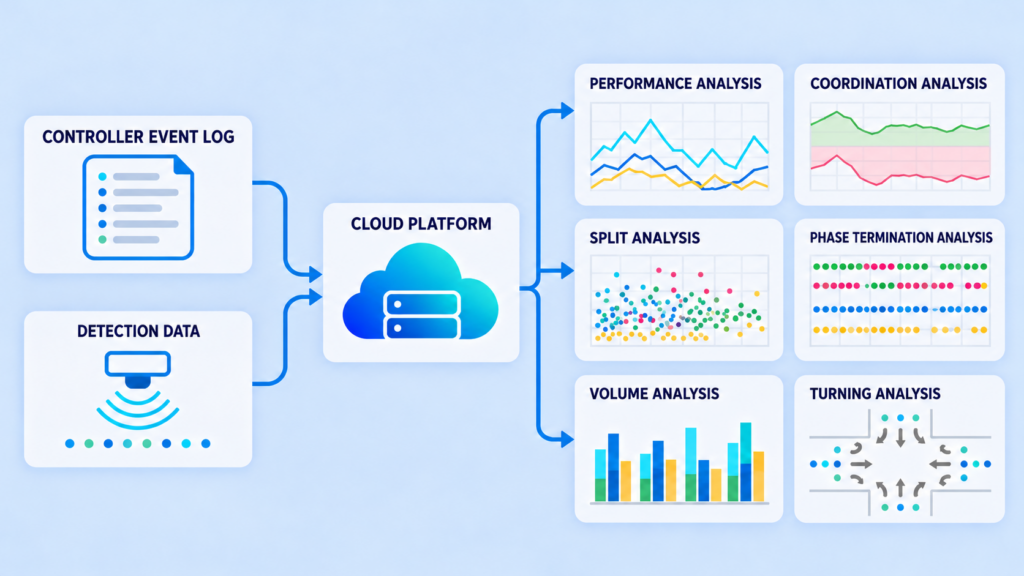
The mechanism is simple. A high-resolution controller logs every event, such as a phase turning green or a detector going on or off, at a tenth-of-a-second resolution. Software pairs those events with detection data and computes measures for every cycle, every day.
Think of it as moving from an annual physical to a fitness tracker. A retiming study is a snapshot. ATSPMs are a continuous trace, so you can see when performance changed and why.
Core measures and what they answer
| Measure | What it shows | Question it answers |
|---|---|---|
| Arrivals on Green / Red | Share of vehicles arriving during green vs. red | Is coordination actually working? |
| Purdue Split Failure | Cycles where the queue didn’t clear on green | Which phases are starved for time? |
| Split Monitor | Green time used per phase over time | Are splits matched to demand? |
| Purdue Phase Termination | Gap-out, max-out, or force-off per cycle | Is a detector failing or a max set too low? |
| Pedestrian Delay | Wait time from button push to WALK | Are pedestrians waiting too long, increasing the risk of a dangerous crossing? |
| Historic Time/Space Diagram | Platoon progression along a corridor | Where does the green band break down? |
The catch is the inputs. Classic ATSPMs need high-resolution logging controllers and well-configured, well-maintained detection. Older controllers and failed loops leave gaps, and setting up detection zones and channel mapping for each intersection takes engineering hours many agencies don’t have.
Removing the barriers to entry
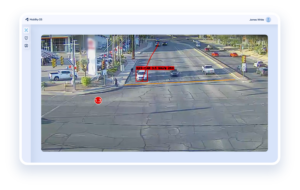
NoTraffic ATSPMs remove the two biggest prerequisites. Measures are computed from the platform’s own camera-and-radar AI detection, so agencies running older controllers without high-resolution logging can still get a full set of performance measures. Detection and phase data come from one system, which means there are no detection zones to configure and no channel mapping to maintain.
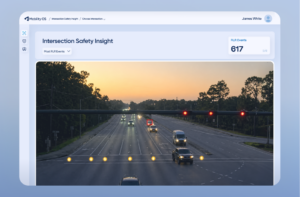
The measures cover the industry-standard set: Split Monitor, Purdue Split Failure, Purdue Phase Termination, Arrivals on Green/Red, Pedestrian Delay, and Historic Time/Space Diagrams. Because they update continuously, staff can scan the network for split failures or max-outs and send crews where the data points, before the phone rings.
Start with your own network
Find out which of your signals would top the list. Book a demo with a NoTraffic expert.
From measuring to improving
ATSPMs tell you where timing falls short. To see what happens when timing keeps up on its own, read our Optimization case studies, like Odessa’s 279:1 return on optimization. The Optimization algorithm works from the measured queue length on every approach, with no detection zones and no on/off calls, and keeps timing current at 1/1000th-of-a-second intervals.